1. Introduction of the experiment.
2. Aim of the experiment.
3. Tools of the experiment.
4. Steps and methods of the experiment.
5. Parameter, Theory and Final law of the experiment.
6. Table of The Readings.
7. Medical application and advantages of the experiment.
This flow rate is of great importance in our lives since it governs things like the flow of blood round our bodies and the transmission of gas, water or oil through long distances in pipelines.
The proof of the relationship was first produced by Poiseuille in 1844 using dimensional analysis (a different proof based on the mechanics of fluids is available, but is outside the scope of this work at this level).
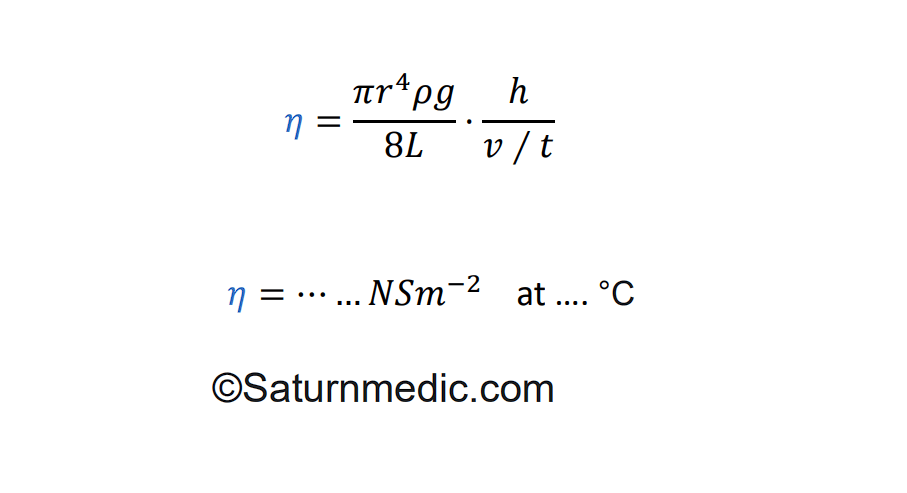
Consider a fluid of viscosity η flowing through a tube of length L and radius r due to a pressure difference Δp between its ends
-To show that the rate of flow is proportional to the applied pressure.
-To deduce the viscosity of water

· Glass capillary tube of internal radius 0.04 cm and length 4 cm
· Stop watch
· A graduated cylinder
· Ruler
· Thermometer
· Rubber tube.

1-Connect the rubber tube to a tap water and see the surplus water discharges into the sink
2-When the water start flow through the capillary tube, make sure that there is no air bubbles in the tube.
3- When the flow of water is steady, hold the capillary tube horizontally in the clamp .
4-measuer the temperature of the water.
5-Measure the height between the level of water and the horizontal capillary tube
6-Hold the stop watch in one hand and the beaker in the other, collect the water in the beaker for a time of 30 second.
7-Read the volume of water
8-Change the height by increase it 5 cm , and go back to step 5 and repeat it 5 times.
9-Plot a graph between the values of h/cm on the X axis against the corresponding values v/t cm3 s -1 on the Y axis
10-The slope of the plotted graph represent the flow rate value h/(v/t) cm2 s -1

Parameters:
ρ: is density of water = (1000 kgm-3)
h: represent the distance between the water level in the container and the level of the capillary tube in (m)
g: is the gravity = (10 ms-2)


7 -Medical Application:
1-blood and nutrition transfusion
2-helps in Sickle cell test ( which is screening test for sickle cell anemia ).
3-Studying hematocrit and fibrinogen level .
4-Studying or test plasma viscosity .